Pinpointing space leaks in big programs
June 10, 2011What is the biggest possible Haskell program that you could try debugging a space leak in? One very good choice is GHC, weighing in nearly a 100k lines of code (though, thankfully, 25% of that figure is comments.) Today, I’m going to describe one such space leak that I have fixed in GHC. This is not a full story: my code was ultimately the culprit, so not covered is how to debug code you did not write. However, I still like to think this story will cover some of the major points:
- How to setup a reproducible and manageable test-case for the leak,
- How to narrow down the source of the space leak,
- How to identify code is more prone to space leaking,
- How to determine what kind of leak it is,
- How to inspect libraries to determine if they are leaky, and
- How to test your fixes to see if they worked.
I really like this case because I had to do all of these things in order to pinpoint and ultimately fix this space leak. I hope you do too!
(Note: The diagrams are a bit big, because I generated them with hp2ps -c in order to make them look as close to what you might actually see in the field—as opposed to my hacked up copy of hp2pretty. Unfortunately, if I resized them, the text would be illegible. Suggestions welcome!)
Trouble in paradise
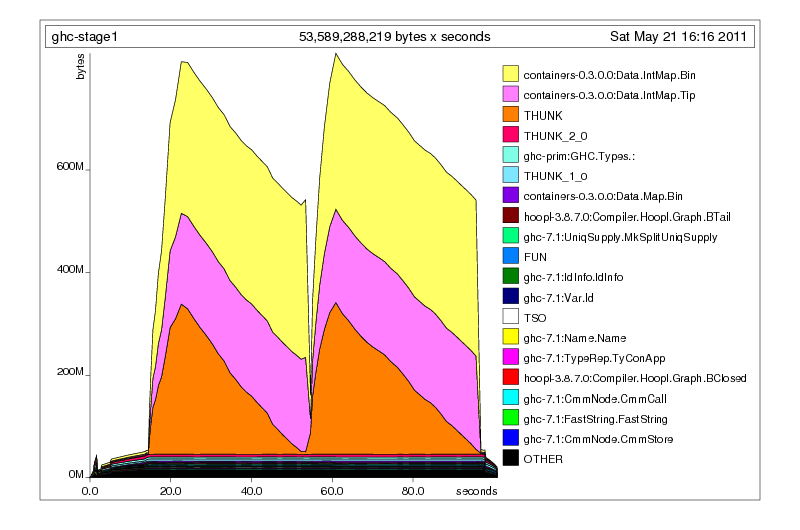
I first noticed something amiss when my builds of GHC with the new code generator enabled at stage 1 and 2 started OOM’ing. I’d come back after letting the build run, and notice that the build had failed on Parser.hs due to an out of memory. (In retrospect, the fact that the failure was from Parser.hs—a half a megabyte ball of autogenerated source code—should have been a good clue.) The first time, I didn’t think much of it: I re-ran the command manually, and it seemed to work. Perhaps I had gotten unlucky and some background process in my machine had been gobbling lots of memory while ghc-stage1 was running.
Of course, it happened again the next time I did a full build, and at that point I thought something a little fishy might have been going on. Because my normal testing did not uncover this problem, and because I did not relish having to spend time fixing a mysterious bug (most bugs in GHC are quite tricky devils to fix), I let things go for a few weeks. What had I done to merit such memory usage? I had no clue. Certainly the -hT profile (which I could easily add, since it doesn’t require you to recompile the program with profiling) wasn’t giving me much: a lot of thunks and integer maps (which, in GHC, are accessed using a wrapper module called UFM, or unique finite maps).
Setting up a test-case
When I finally got around to attacking this bug seriously, the first thing I wanted to do was make a reduced test-case of Parser.hs, effectively the input file that was causing the out-of-memory. Why not test on Parser.hs directly?
- Big inputs result in lots of data, and if you don’t really know what you’re looking for lots of data is overwhelming and confusing. The answer might be really obvious, but if there is too much cruft you’ll miss it.
- This was a file that was OOM-ing a machine with 2GB of RAM. Space is time, and Haskell programs that use this much memory take correspondingly longer to run. If I was looking to make incremental changes and re-test (which was the hope), waiting half an hour between iterations is not appealing.
- It was a strategy that had worked for me in the past, and so it seemed like a good place to start collecting information.
Actually, I cheated: I was able to find another substantially smaller test file lying around in GHC’s test suite that matched the heap profile of GHC when run on Parser.hs, so I turned my attentions there.
In your case, you may not have a “smaller” test case lying around. In that case, you will need to reduce your test-case. Fortunately, inputs that are not source programs tend to be a lot easier to reduce!
- Binary search for a smaller size. Your null hypothesis should be that the space leak has been caused strictly more data, so if you delete half of your input data, the leak should still be present, just not as severe. Don’t bother with anything sophisticated if you can chop and re-test.
- Sometimes a space leak is caused by a specific type of input, in which case deleting one half of the input set may cause the leak to go away. In this case, the first thing you should test is the other half of the input set: the culprit data is probably there, and you can continue binary searching on that chunk of code. In the worst case scenario (removing either half causes the leak to go away), buckle down and start selectively removing lines that you believe are “low risk.” If you remove a single line of data and the leak goes away, you have some very good data about what may actually be happening algorithmically.
- In the case of input data that has dependencies (for example, source code module imports), attempt to eliminate the dependencies first by re-creating them with stub data.
In the best case situation, this process will only take a few minutes. In the worst case situation, this process may take an hour or so but will yield good insights about the nature of the problem. Indeed, after I had gotten my new test-case, I reduced it even further, until it was a nice compact size that I could include in a blog post:
main = print $ length [
  ([0,0,0],0),([0,0,0],0),([0,0,0],0),([0,0,0],0),([0,0,0],0),
  ([0,0,0],0),([0,0,0],0),([0,0,0],0),([0,0,0],0),([0,0,0],0),
  ([0,0,0],0),([0,0,0],0),([0,0,0],0),([0,0,0],0),([0,0,0],0),
  ([0,0,0],0),([0,0,0],0),([0,0,0],0),([0,0,0],0),([0,0,0],0),
  ([0,0,0],0),([0,0,0],0),([0,0,0],0),([0,0,0],0),([0,0,0],0),
  ([0,0,0],0),([0,0,0],0),([0,0,0],0),([0,0,0],0),([0,0,0],0),
  ([0,0,0],0),([0,0,0],0),([0,0,0],0),([0,0,0],0),([0,0,0],0),
  ([0,0,0],0),([0,0,0],0),([0,0,0],0),([0,0,0],0),([0,0,0],0),
  ([0,0,0],0),([0,0,0],0),([0,0,0],0),([0,0,0],0),([0,0,0],0),
  ([0,0,0],0),([0,0,0],0),([0,0,0],0),([0,0,0],0),([0,0,0],0),
  ([0,0,0],0),([0,0,0],0),([0,0,0],0),([0,0,0],0),([0,0,0],0),
  ([0,0,0],0),([0,0,0],0),([0,0,0],0),([0,0,0],0),([0,0,0],0),
  ([0,0,0],0),([0,0,0],0),([0,0,0],0),([0,0,0],0),([0,0,0],0),
  ([0,0,0],0),([0,0,0],0),([0,0,0],0),([0,0,0],0),([0,0,0],0),
  ([0,0,0],0),([0,0,0],0),([0,0,0],0),([0,0,0],0),([0,0,0],0),
  ([0,0,0],0),([0,0,0],0),([0,0,0],0),([0,0,0],0),([0,0,0],0),
  ([0,0,0],0),([0,0,0],0),([0,0,0],0),([0,0,0],0),([0,0,0],0)]
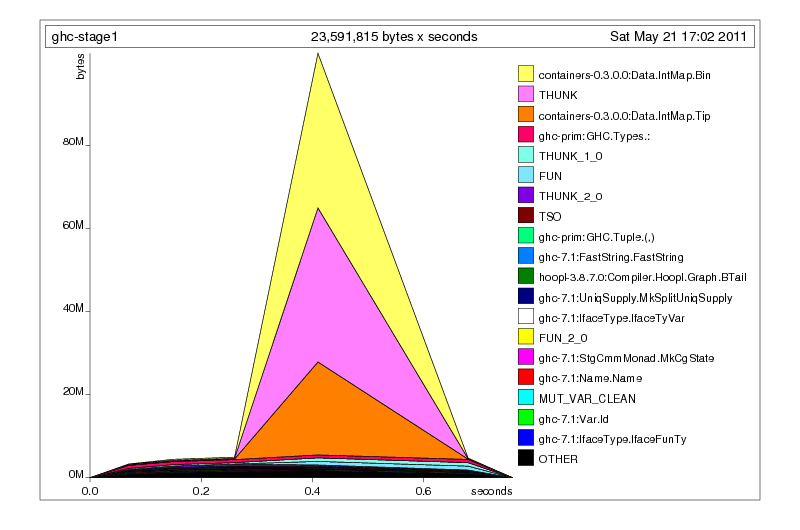
A plain heap profile of looks very similar to the bigger Parser case, and even if it’s a different space leak, it’s still worth fixing.
Narrowing down the source
After you have your test case, the next step is to compile with profiling enabled. With GHC, this is as simple as switching your build settings to build a profiled stage 2 compiler; for a more ordinary Haskell project, all you need to do is add -prof -auto-all to your ghc invocation, or invoke Cabal with --enable-executable-profiling --enable-library-profiling --ghc-option=-auto-all. You may need to install profiling versions of your libraries, so a useful line to have in your .cabal/config file is library-profiling: True, which causes all libraries you cabal install or cabal configure to have profiling enabled. In fact, if you don’t have this setting on, turn it on right now. The extra time you spend when installing packages is well worth it when you actually want to profile something.
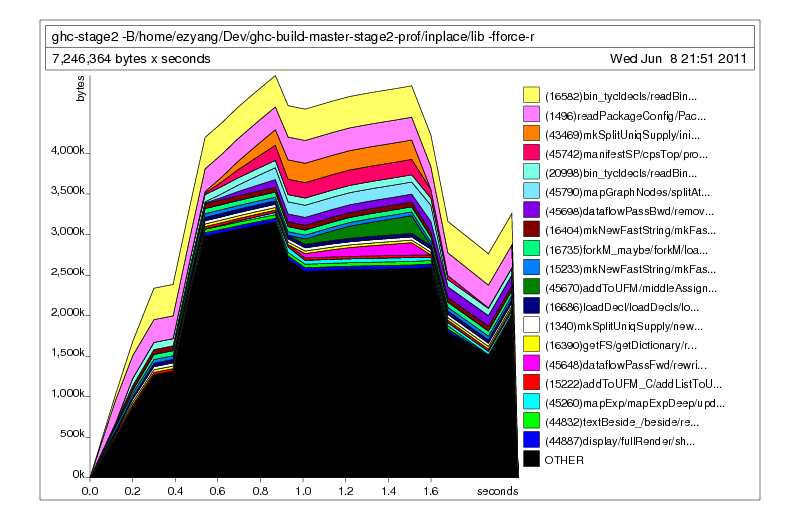
GHC has a large array of heap and time profiling options, but in general, the first two flags you want to try are -hc (for a traditional, cost-center based heap profile) and -prof (this gives a time profile—but we’ll see how this can be useful):
./ghc-stage2 -fforce-recomp -c Mu.hs +RTS -hc
./ghc-stage2 -fforce-recomp -c Mu.hs +RTS -prof
One quick remark: the program being tested here is ghc-stage2.hs (which is really big), not Mu.hs (which is really small.) I don’t actually care about what the output program is!
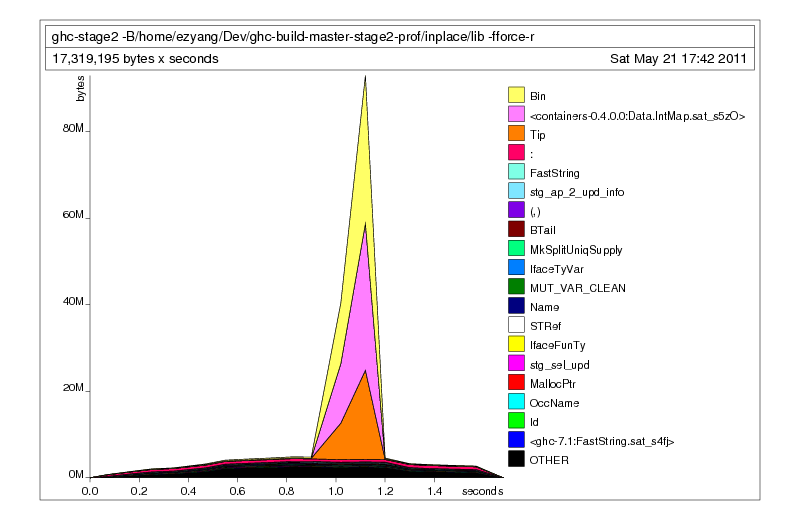
Here’s what the heap report tells us.
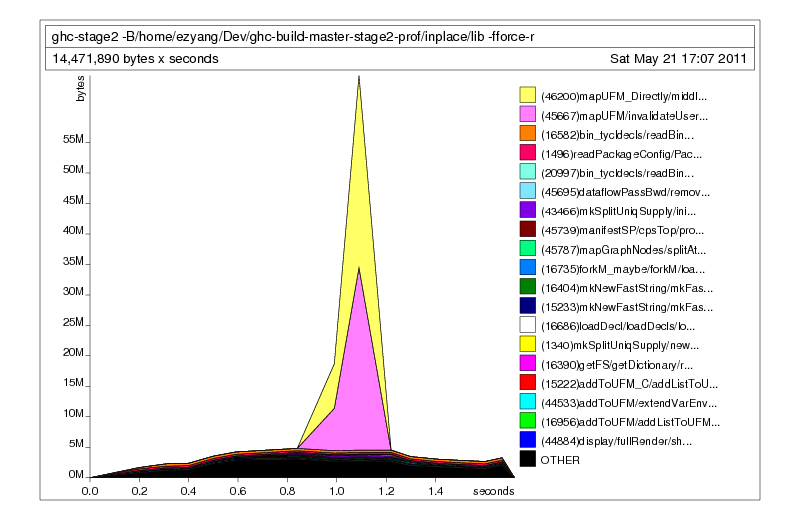
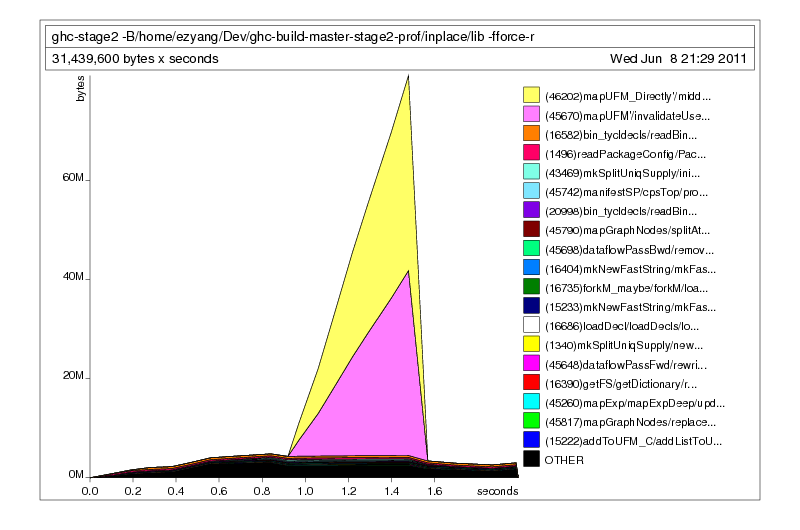
This is much better; rather than telling us what was on the heap, it tells us who put it on the heap. The main offenders seem to be mapUFM and mapUFM_Directly, which are utility functions mapping IntMap. But we also see that they are being called by two other functions. Their names have been truncated, but this is no problem: we can simply rerun the profiler with a longer cost center name using the -L flag:
./ghc-stage2 -fforce-recomp -c Mu.hs +RTS -hc -L50
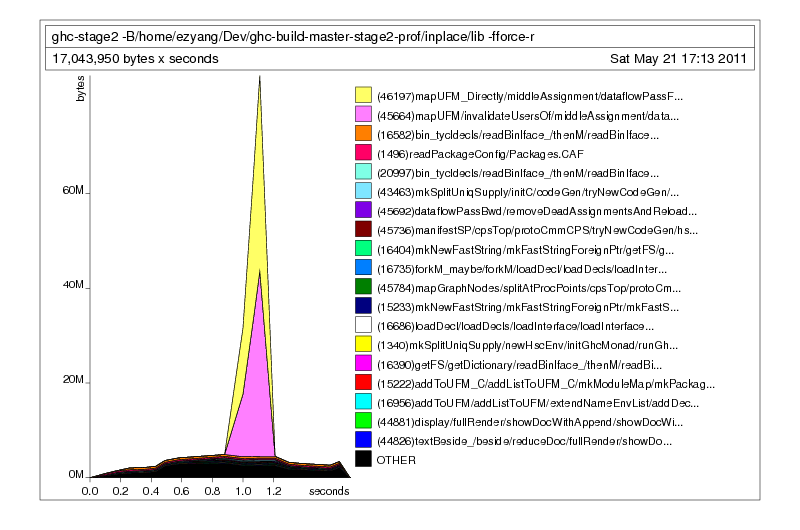
Much better! You could have also consulted the prof file to find the primary callees of the offending functions:
individual     inherited
COST CENTRE          MODULE             no.  entries %time %alloc   %time %alloc
middleAssignment     CmmSpillReload   45804     5324   0.0    0.0    15.7   33.8
callerSaves         StgCmmUtils      46347        8   0.0    0.0     0.0    0.0
wrapRecExpf         CmmNode          46346        8   0.0    0.0     0.0    0.0
xassign             CmmSpillReload   46345        8   0.0    0.0     0.0    0.0
foldUFM_Directly    UniqFM           46344        4   0.0    0.0     0.0    0.0
mapUFM_Directly     UniqFM           46343     1633   9.0   17.3     9.0   17.3
deleteSinks          CmmSpillReload   45811     3524   0.0    0.0     0.0    0.0
invalidateUsersOf    CmmSpillReload   45809     1887   0.0    0.0     6.7   16.4
regUsedIn           CmmExpr          45821     6123   1.1    0.0     1.1    0.0
xassign             CmmSpillReload   45820     6123   0.0    0.0     0.0    0.0
mapUFM              UniqFM           45810     1887   5.6   16.4     5.6   16.4
Wondrous. We pull open the definitions for mapUFM, mapUFM_Directly, middleAssignment and invalidateUsersOf, all four of which constitute suspicious functions in which the space leak may lurk.
Use the source
Here I reproduce the relevant source code snippets. mapUFM and mapUFM_Directly are very thin wrappers around M, which is a qualified import for IntMap:
mapUFM f (UFM m) = UFM (M.map f m)
mapUFM_Directly f (UFM m) = UFM (M.mapWithKey (f . getUnique) m)
invalidateUsersOf is a relatively self-contained function:
-- Invalidates any expressions that use a register.
invalidateUsersOf :: CmmReg -> AssignmentMap -> AssignmentMap
invalidateUsersOf reg = mapUFM (invalidateUsers' reg)
  where invalidateUsers' reg (xassign -> Just e) | reg `regUsedIn` e = NeverOptimize
        invalidateUsers' _ old = old
middleAssignment is a bit trickier: it’s a very large function with many cases, but only one case has an invocation of mapUFM_Directly in it:
-- Algorithm for stores:
--  1. Delete any sinking assignments that were used by this instruction
--  2. Look for all assignments that load from memory locations that
--     were clobbered by this store and invalidate them.
middleAssignment (Plain n@(CmmStore lhs rhs)) assign
    = mapUFM_Directly p . deleteSinks n $ assign
      where p r (xassign -> Just x) | (lhs, rhs) `clobbers` (r, x) = NeverOptimize
            p _ old = old
I would like to remark how small the amount of code we have to look at is. If they were much larger, one sensible thing to do would have been to instrument manually with more SCC pragmas, so that you can figure out what local definition to zoom in on. Once you have a small segment of code like this, one of the best ways to proceed is debugging by inspection: that is, stare at the code until the bug becomes obvious.
A thunk leak?
If you’ve ever fixed a space leak in Haskell before, or have been reading this blog regularly, there should be an obvious first guess: mapUFM is too lazy, and we are thus accumulating thunks. This is consistent with the presence of thunks in our initial heap profiles. A keen reader may have noticed that the thunks aren’t present in our hc profile, because thunks are not cost-centers. We can verify that they’re still hanging around, though, by running an hd profile:
./ghc-stage2 -fforce-recomp -c Mu.hs +RTS -hd
That sat_s5zO is the precise thunk from IntMap that is leaking. A quick look at the source code of IntMap confirms our suspicion:
data IntMap a = Nil
              | Tip {-# UNPACK #-} !Key a
              | Bin {-# UNPACK #-} !Prefix
                    {-# UNPACK #-} !Mask
                    !(IntMap a) !(IntMap a)

mapWithKey :: (Key -> a -> b) -> IntMap a -> IntMap b
mapWithKey f = go
  where
   go (Bin p m l r) = Bin p m (go l) (go r)
   go (Tip k x)     = Tip k (f k x)
   go Nil           = Nil
IntMap is spine-strict, but mapWithKey (which is invoked , lacking any bang-patterns, is clearly lazy in the update function f. Annoyingly enough, it seems that there is no strict version of the function either. Well, let’s quickly add a strict version of this function and test it out:
mapWithKey' f t
  = case t of
      Bin p m l r -> Bin p m (mapWithKey' f l) (mapWithKey' f r)
      Tip k x     -> let v = f k x in v `seq` Tip k v
      Nil         -> Nil
After a recompile, we see the following results with -hc:
Uh oh! The memory usage improved slightly, but it still looks pretty bad. Did we do something wrong? Let’s find out what the objects on the heap actually look like with -hd:
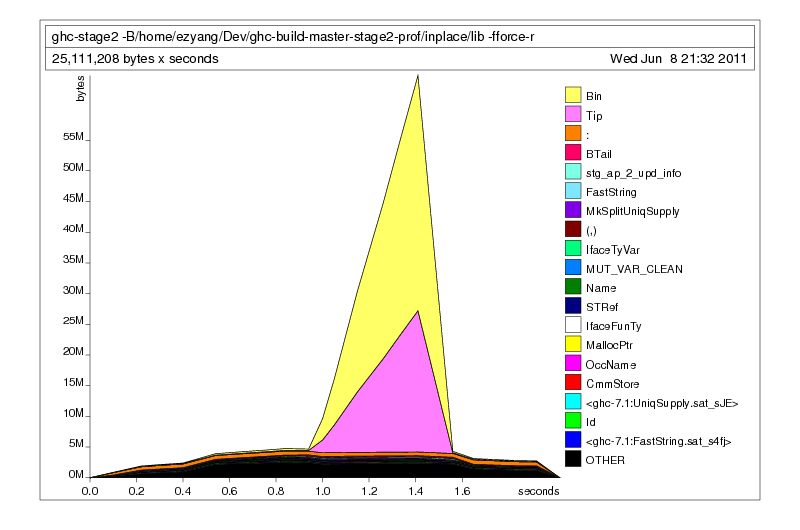
Notice that the thunks have disappeared from the profile! The fix was successful: we’ve eliminated the thunks. Unfortunately, none of the IntMap constructors Bin or Tip have gone away, and those are the true space leaks. So what’s holding on to them? We can use retainer profiling with -hr:
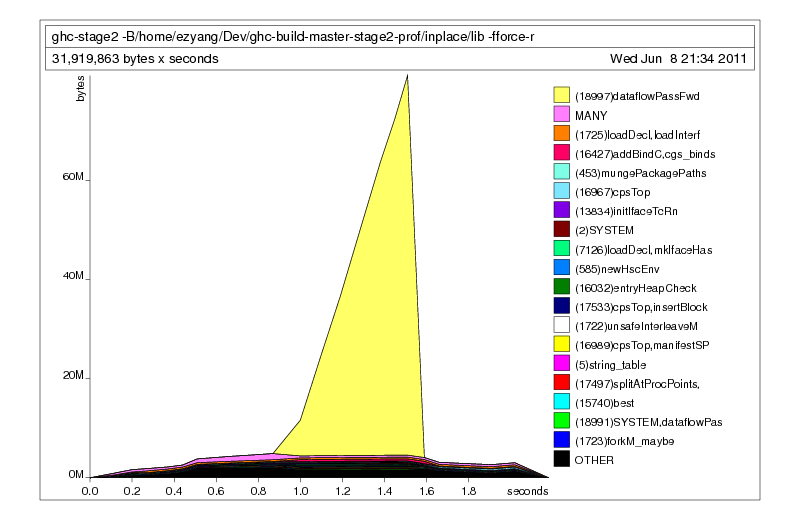
This is not a space leak. In fact, it may very well be a problem with the algorithm we are using. We discard our thunk leak hypothesis, and go back to the drawing board.
Lack of sharing
I will admit, when I got to this point of the debugging, I was pretty displeased. I thought I had pinned down the space leak, but swapping in a strict map hadn’t helped at all. Instead, all of the maps were being retained by the dataflow pass stage, and I knew I couldn’t eliminate those references, because that was how the algorithm worked. The dataflow analysis algorithm in GHC needs to retain the map it calculates for a given node, because the map is necessary for performing rewrites at every point of the graph, and may be reused in the event of a loop. It would take substantial cleverness to use the map in a non-persistent way.
But it seemed fairly unlikely that this code was strictly to blame, since we had used it with great success in many other parts of the code. Then I had an insight. The map in IntMap does not perform any sharing at all with the original structure: it needs to reconstruct all of the internal nodes. When the function being mapped over the structures preserves the original value of most of the map entries, this is quite wasteful. So perhaps a better strategy would be to pre-calculate which map entries changed, and only update those entries. If no inserts are made, the map gets completely shared; if one insert is made, the majority of the map continues to be shared (only the path is rewritten.) The rewritten functions then look as follows:
invalidateUsersOf reg m = foldUFM_Directly f m m
    where f u (xassign -> Just e) m | reg `regUsedIn` e = addToUFM_Directly m u NeverOptimize
          f _ _ m = m

middleAssignment (Plain n@(CmmStore lhs rhs)) assign
    = let m = deleteSinks n assign
      in foldUFM_Directly f m m
      where f u (xassign -> Just x) m | (lhs, rhs) `clobbers` (u, x) = addToUFM_Directly m u NeverOptimize
            f _ _ m = m
Guess what: it worked!
Optimistic, I spun up a new full compile, and most gratifyingly, it did not out-of memory. Victory!
Conclusion
The point of this post was not to show you how lack of sharing could cause the space usage of an algorithm to blow up—delving into this topic in more detail is a subject for another post. The point was to demonstrate how GHC’s profiling tools can really home in on the source of a leak and also let you know if your fixes worked or not. Ultimately, fixing space leaks is a lot like debugging: after you’ve checked the usual culprits, every situation tends to be different. (Of course, check the usual culprits first! They might work, unlike in this situation.)
In particular, I want to emphasize that just because one particular fix didn’t work, doesn’t mean that the leak isn’t still in the location indicated by profiling. The ultimate fix was still in the very same place as the profiling suggested, and checking the retainers also indicated the algorithm that was ultimately tickling a lack of sharing. Furthermore, once you have a reduced test-case that exhibits the leak, making small changes and seeing how the heap usage changing is extremely fast: even for a huge codebase like GHC, a small source level change only results in a ten second recompile, and getting fresh heap statistics only takes another five seconds. This is fast and allows you to experiment.
Now go forth, and slay space bugs in even the largest programs without fear!
6 Comments