Anatomy of a thunk leak
May 18, 2011In this post, we discuss the characteristics of a thunk leak, the leak that has come to symbolize the difficulties of “reasoning about space usage” in Haskell. I’ll consider a few examples of this type of leak and argue that these leaks are actually trivial to fix. Rather, the difficulty is when a thunk leak gets confused with other types of leaks (which we will cover in later posts).
Description
I’ll be describing the various leaks in two ways: I will first give an informal, concrete description using the metaphor I developed in the Haskell Heap series, and then I will give a more direct, clinical treatment at the end. If you can’t stand one form of explanation or the other, feel free to skip around.
Thunk leaks occur when too many wrapped presents (thunks) are lying around at the same time.

The creation of thunks is not necessarily a bad thing: indeed, most Haskell programs generate lots of thunks. Sometimes the presence of thunks on the heap is unavoidable. The problem is when they do not get evaluated in due course: like socks in the room of a lazy college student, they start piling up.

There is a precise sense by which the thunks “pile” up, which can be observed by looking at the presents the ghosts care about.

Each ghost cares about the next present in the pile (so the Grinch can’t steal them away), and we (the user) care about the present at the very bottom of the pile. Thus, when we open that present, the whole chain of presents comes toppling down (assuming there are not other references pointed to the pile).
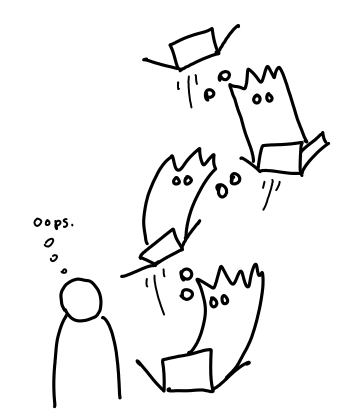
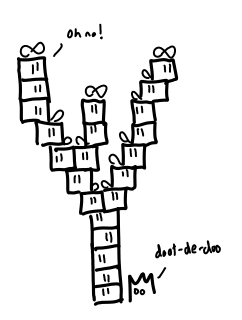
The chain of thunks could really be any shape you want, though linear is the usual case.
What would fixing the problem look like? It’s certainly not waiting until the presents get piled up and then cleaning them up in one go (as our college student might do): the damage (big memory usage) has already been done!
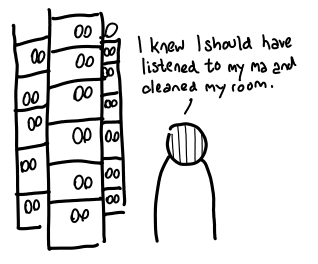
Rather, we should be a bit more eager and open up our presents as we get them.
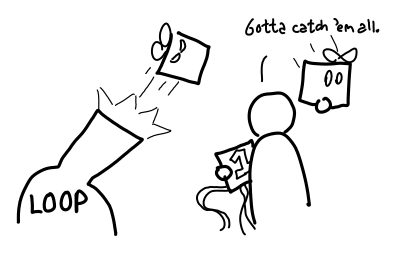
This strategy can fail, however. If opening the presents results in something even bigger than we started off with or if we might not need to open all the presents, we might be better off just being lazy about it.
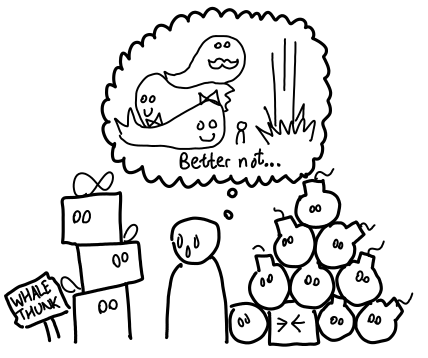
There’s also the question of where all these presents came from in the first place. Maybe we were too eager about getting the presents in the first place…
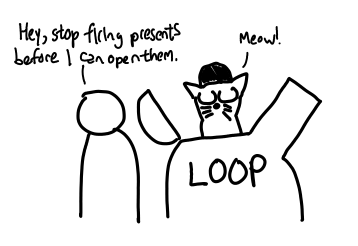
In summary, a thunk leak is when a Haskell program builds up a large number of thunks that, if evaluated, would result in much smaller memory usage. This requires such thunks to have several properties:
- They must not have external references to them (since the idea is as the thunks are evaluated, their results can get garbage collected),
- They must perform some sort of reduction, rather than create a bigger data structure, and
- They should be necessary.
If (1) fails, it is much more probable that these thunks are legitimate and only incur a small overhead (and the real difficulty is an algorithmic one). If (2) fails, evaluating all of the thunks can exacerbate the memory situation. And if (3) fails, you might be looking at a failure of streaming, since thunks are being eagerly created but lazily evaluated (they should be lazily created as well).
Diagnosis
As with most space leaks, they usually only get investigated when someone notices that memory usage is unusually high. However, thunk leaks also tend to result in stack overflows when these thunk chains get reduced (though not always: a thunk chain could be tail recursive.) As with all performance tuning, you should only tune while you are doing measurements: otherwise, you may spend a lot of time optimizing something that is relatively insignificant (or worse yet, that GHC already optimized for you!)
The next line of diagnosis is the heap residency profile, which does not require you to recompile your program with profiling enabled. Just add -hT as an RTS flag. In the case of thunk leak, the heap profile is very tell-tale: a large chunk of the heap will be occupied with THUNK. Bingo!
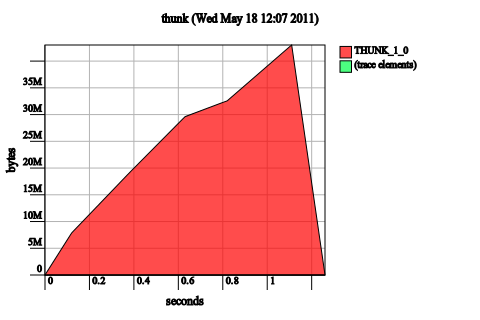
Note. This diagnostic step is why I’ve chosen to distinguish between thunk leaks and live variable leaks. A thunk leak will have thunks dominating the heap because the thunks themselves are numerous and are consuming memory. A live variable leak may be caused by a thunk retaining extra memory, but the thunks themselves may not necessarily show up on the heap, because you only need one reachable thunk to cause memory to be retained.
Examples
I’ve distilled some examples in order to help illustrate the phenomenon in question, as well as give direct, source-level indications on all the possible ways you can go about fixing the leak. I’ll also give some examples of things that could have leaked, but didn’t because GHC was sufficiently clever (hooray for optimizations!) Runnable code can be found in the GitHub repository, which I will try to keep up-to-date.
We’ll first start with the classic space leak from naive iterative code:
main = evaluate (f [1..4000000] (0 :: Int))

f []     c = c
f (x:xs) c = f xs (c + 1)
It should be obvious who is accumulating the thunks: it’s c + 1. What is less obvious, is that this code does not leak when you compile GHC with optimizations. Why is this the case? A quick look at the Core will tell us why:
Main.$wf =
  \ (w_s1OX :: [GHC.Integer.Type.Integer])
    (ww_s1P0 :: GHC.Prim.Int#) ->
    case w_s1OX of _ {
      [] -> ww_s1P0;
      : _ xs_a1MR -> Main.$wf xs_a1MR (GHC.Prim.+# ww_s1P0 1)
    }
Notice that the type of c (renamed to ww_s1P0) is GHC.Prim.Int#, rather than Int. As this is a primitive type, it is unlifted: it is impossible to create thunks of this type. So GHC manages to avoid thunks by not creating them at all in the first place. Fixing the unoptimized case is as simple as making c strict, since addition of integers is a strict function.
It is not, in general, possible for GHC to do this kind of unboxing optimization without violating the semantics of our code. Our next piece of code looks at precisely such a case:
main = do
    evaluate (f [1..4000000] (0 :: Int, 1 :: Int))

f []     c = c
f (x:xs) c = f xs (tick x c)

tick x (c0, c1) | even x    = (c0, c1 + 1)
                | otherwise = (c0 + 1, c1)
This space leaks both with and without optimizations. It also stack overflows.
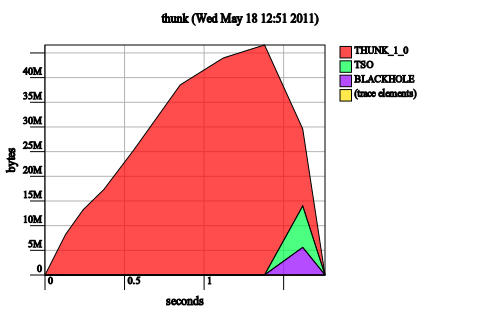
It is not possible for GHC to optimize this code in such a way that the elements of the pair are eagerly evaluated without changing the semantics of the function f. Why is this the case? We consider an alternate call to f: f [1..4000000] (0, undefined). The current semantics of the function demand that the result be (2000000, undefined) (since anything added to undefined is undefined), which means we cannot do any evaluation until the inside of the resulting tuple is forced. If we only ever evaluate the tuple to whnf (as the call to evaluate does) or if we only ever use the first result, then no exception should be thrown. This is indeed the case if we replace 1 :: Int with undefined and run the program.
OK, that’s enough theory, how do we fix this bug? I could just give you a single answer, but I think it will be more informative if we consider a range of possible fixes and analyze their effect on the program. Hopefully, this will make space leaks less like casting the runes, and much more methodical.
Add a bang-pattern to c in f. This doesn’t work:
f []     !c = c
f (x:xs) !c = f xs (tick x c)
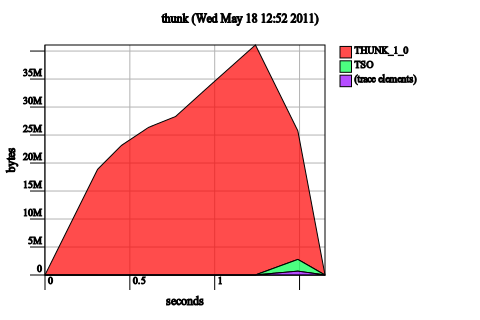
The insight is that we’ve not changed the semantics of the function at all: f l (undefined, undefined) still should result in (undefined, undefined), since seq doesn’t “look inside the tuple”. However, adding this bang-pattern may help in the construction of other solutions, if evaluating the tuple itself has other side-effects (as we might say, that ghost might open some presents for us).
Make the tuple in tick irrefutable. This is just confused:
tick x ~(c0, c1) | even x    = (c0, c1 + 1)
                 | otherwise = (c0 + 1, c1)
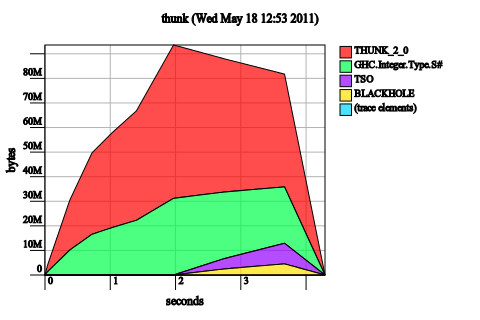
Irrefutable patterns add laziness, not strictness, so it’s not surprising that the problem has gotten worse (note the memory usage is now up to 80M, rather than 40M).
Make tick strict. Notice that the x is already forced immediately by even x, so there’s no need to add a bang pattern there. So we just add bang patterns to c0 and c1:
tick x (!c0, !c1) | even x    = (c0, c1 + 1)
                  | otherwise = (c0 + 1, c1)
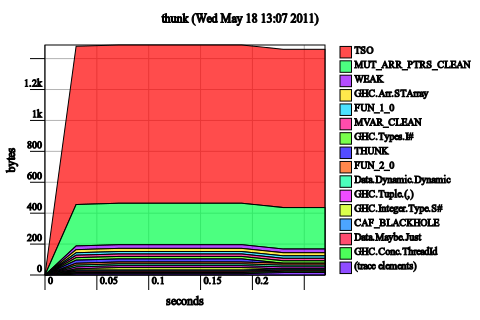
These might look like a terrible graph, but look at the scale. 1.2 kilobytes. In general, if after you make a change to a Haskell program and you start seeing lots of bands again, it means you’ve fixed the leak. So we’ve fixed it!
Well, not quite. The unoptimized code still has a leak:
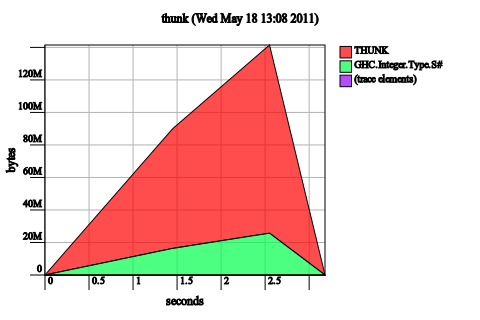
We fixed our space leak by enabling a GHC optimization, similar to the one that fixed our original space leak. Once again, the Core makes this clear:
Main.$wf :: [GHC.Integer.Type.Integer]
            -> GHC.Types.Int
            -> GHC.Types.Int
            -> (# GHC.Types.Int, GHC.Types.Int #)
GHC has optimized the tuple away into an unboxed return and inlined the call to tick, as a result we don’t have any tuple thunks floating around. We could have manually performed this optimization, but it’s better to the let the compiler do it for us (and keep our code clean.)
Strictify tick and f. In analogy with the first example, now that tick is strict, if we strictify both places, the unoptimized code will also be fine. And indeed, it is.
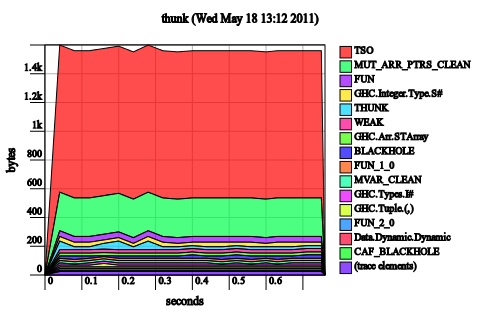
It doesn’t help us much for the optimized case though! (There is essentially no change to the heap profile.)
Make the pair strict. Using a strict pair instead of the default lazy pair is equivalent to inserting bang patterns every where we pattern match on a tuple. It is thus equivalent to strictifying tick, and if you do this you will still need a little extra to get it working in the unoptimized case. This tends to work better when you control the data structure that is going into the loop, since you don’t need to change all of your data declarations.
Deep seq c. If a simple bang pattern for c doesn’t work, a deep bang pattern will:
f []     c = c
f (x:xs) c@(!_,!_) = f xs (tick x c)
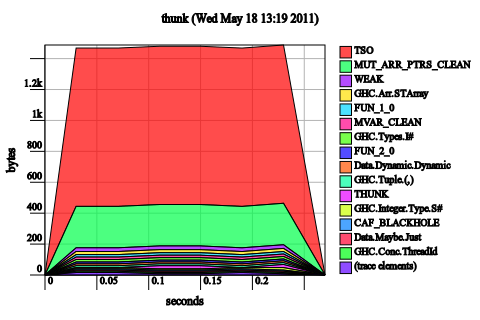
Alternatively, you could have used rnf from the deep seq package. While this does work, I personally think that it’s better policy to just use a strict data type, if you’re going to be rnf’ing willy-nilly, you might as well keep things fully evaluated all the time.
I had another example, but I’m out of time for today! As some parting words, note that tuples aren’t the only lifted types floating around: everything from records to single data constructors (data I a = I a) to mutable references have these extra semantics which can have extra space costs. But identifying and fixing this particular problem is really easy: the heap profile is distinctive, the fix is easy and non-invasive, and you even have denotational semantics to aid your analysis of the code! All you need is a little extra knowledge.
Postscript. Apologies for the wildly varying graph axes and shifty colors. Try to focus on the shape and labeling. I’m still wrangling hp2pretty to get it to generate the right kinds of heap profiles, and I need a more consistent scaling mechanism and more consistent coloring. Experiments were done on GHC 6.12.3.
I think this is where the analogy with presents and ghosts becomes unhelpful, despite the nice pictures.
The point is that you can simply take the expression and evaluate it by hand f [1..4000000] 0 = f [2..4000000] (0+1) = f [3..4000000] ((0+1)+1) = … without any understanding of how GHC implements the Haskell heap. The size of the expression is directly proportional to its memory use.
You can treat the Core output as expressions as well, only you have to know that
Int#are evaluated eagerly.Likewise for the other examples.
You don’t even need to know about denotational semantics, even though this can be very helpful for detecting unevaluated expressions.
I have to respectfully disagree. I will certainly grant for some people, the ghost metaphor may be unhelpful (I point this out in the introduction to the section.) But I strongly believe that there are people who have trouble with this purely syntactic notion of space usage (“But surely 0+1 is just 1! My computer should be smart enough to figure that out”), for whom making the thunks very tangible is very important to understanding.
I also think the denotational semantics are very important to understanding when GHC can optimize away a leak and when it cannot. But that might just be me. :-)
Good point, making
0+1tangible (“it’s not 1, it’s something else!”) is a key step to understanding lazy evaluation. However, three points:Skipping the purely syntactic view is poor Haskell. After all, formal manipulation of expressions is the raison-d’être for Haskell. How you get there is your business, but the simply and clean formalism should be the goal. You can get by with some denotational semantics, but it’s no substitute.
The ghosts and presents would add a lot more value if they made expressions tangible instead of replacing them entirely. (I don’t see how exactly a ghost corresponds to code I wrote down.) (Also, the ghosts contain superfluous implementation details.)
The traditional path to tangible expressions is via graph reduction. The graphs for
0+1and1are quite different.I’ll see if I can add references to graph reduction in my future drawings, though I really want to emphasize that the point of the series is not to teach people how to use a formalism. (Of course, this is a bit hypocritical of me because I get antsy when people fail to present a formalism properly.)
I’m not sure what you mean by superfluous implementation details.
I may be indicating that I’m missing the point entirely, but shouldn’t there be a ‘not’ after ‘assuming’ below?
Thus, when we open that present, the whole chain of presents comes toppling down (assuming other references pointed to the pile).
Great series, thank you Edward ! I don’t know if the ghost analogy is perfect or not, but I’m sure I appreciate it because ghosts illustrate ideas related to evaluation, and make your article very pleasant to follow, which is great and hard to obtain !
Finaly, everytime I read an article showing “how to circumvant Haskell lazy evaluation model”, I like read some reminders of why lazy evaluation can be a good thing. Being able to write ‘f undefined’ is not so appealing :)
Paul R: You should pretend, in your head, that undefined represents a really expensive computation. If you can say
f undefinedwithout causing an undefined result, that means you were able to skip doing that computation. That’s a good thing!Heinrich Apfelmus: True. But I think CAFs are important to understanding some types of space leaks. (Indirections much less so, admittedly.)