ezyang’s blog

the arc of software bends towards understanding

DP Zoo Tour

Someone told me it’s all happening at the zoo...

I’ve always thought dynamic programming was a pretty crummy name for the practice of storing sub-calculations to be used later. Why not call it table-filling algorithms, because indeed, thinking of a dynamic programming algorithm as one that fills in a table is a quite good way of thinking about it.

In fact, you can almost completely characterize a dynamic programming algorithm by the shape of its table and how the data flows from one cell to another. And if you know what this looks like, you can often just read off the complexity without knowing anything about the problem.

So what I did was collected up a bunch of dynamic programming problems from Introduction to Algorithms and drew up the tables and data flows. Here’s an easy one to start off with, which solves the Assembly-Line problem:

/img/dp-zoo/path.png

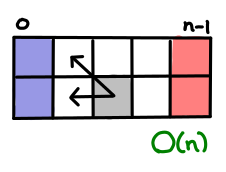
The blue indicates the cells we can fill in ‘for free’, since they have no dependencies on other cells. The red indicates cells that we want to figure out, in order to pick the optimal solution from them. And the grey indicates a representative cell along the way, and its data dependency. In this case, the optimal path for a machine to a given cell only depends on the optimal paths to the two cells before it. (Because, if there was a more optimal route, than it would have shown in my previous two cells!) We also see there are a constant number of arrows out of any cell and O(n) cells in this table, so the algorithm clearly takes O(n) time total.


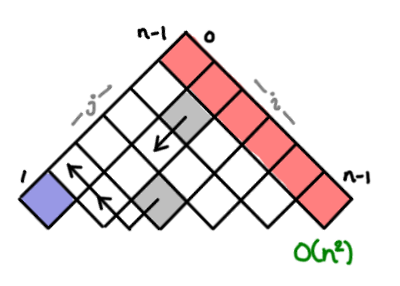
Here’s the next introduction example, optimal parenthesization of matrix multiplication.

/img/dp-zoo/matrix.png

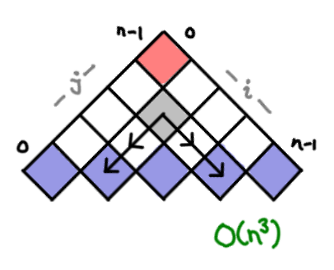
Each cell contains the optimal parenthesization of the subset i to j of matrixes. To figure this out the value for a cell, we have to consider all of the possible combos of existing parentheticals that could have lead to this (thus the multiple arrows). There are O(n²) boxes, and O(n) arrows, for O(n³) overall.


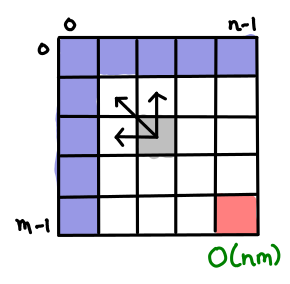
Here’s a nice boxy one for finding the longest shared subsequence of two strings. Each cell represents the longest shared subsequence of the first string up to x and the second string up to y. I’ll let the reader count the cells and arrows and verify the complexity is correct.

/img/dp-zoo/subsequence.png

There aren’t that many ways to setup dynamic programming tables! Constructing optimal binary search trees acts a lot like optimal matrix parenthesization. But the indexes are a bit fiddly. (Oh, by the way, Introduction to Algorithms is 1-indexed; I’ve switched to 0-indexing here for my examples.)

/img/dp-zoo/binary.png

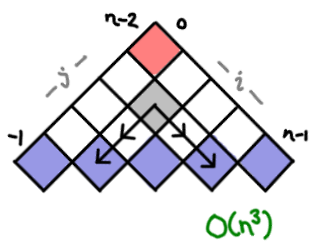
Here we get into exercise land! The bitonic Euclidean traveling salesman problem is pretty well-known on the web, and its tricky recurrence relation has to do with the bottom edge. Each cell represents the optimal open bitonic route between i and j.

/img/dp-zoo/bitonic.png

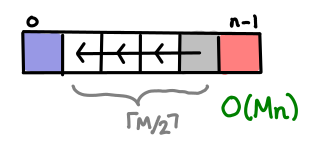
The lovely word wrapping problem, a variant of which lies at the heart of the Knuth TeX word wrapping algorithm, takes advantage of some extra information to bound the number of cells one has to look back. (The TeX algorithm does a global optimization, so the complexity would be O(n²) instead.) Each cell represents the optimal word wrapping of all the words up to that point.

/img/dp-zoo/text.png

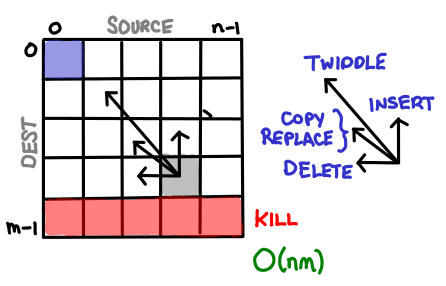
Finally, the edit problem, which seems like the authors decided to pile on as much complexity as they could muster, falls out nicely when you realize each string operation they order you to design corresponds to a single arrow to some earlier cell. Useful! Each cell is the optimal edit chain from that prefix of the source to that prefix of the destination.

/img/dp-zoo/edit.png

And the zookeeper is very fond of rum.

Squares, triangles, rectangles, those were the tables I usually found. I’m curious to know if there are more exotic tables that DP algorithms have filled out. Send them in and I’ll draw them!

13 Responses to “DP Zoo Tour”

  1. Mike Rosulek says:

    I like this notation and will show it to my algorithms students!

    BTW, the name “dynamic programming” does actually (kinda) mean “filling up a table”.. at least it comes from an antiquated usage of the word “programming” from the 1950s, which refers to using a table rather than coding in a computer language.

    Which “Introduction to Algorithms” are you using? It would be nice to see the descriptions of the algorithms as well. I can see what the algorithms are doing by looking at your diagrams, but for example I don’t know the “assembly line” problem by that name. The others seem more standard.

    If the space of subproblems is 2-dimensional then you will be unlikely to see anything other than squares, rectangles, triangles. Some DP problems have 3-, 4-, whatever-dimensional spaces of subproblems. Possibly the most natural one I can think of is the Floyd-Warshall algorithm for all-pairs shortest paths, with a 3-dimensional subproblem space. Don’t know how you’re going to draw it though ;)

    There is also the “seam carving” algorithm — the problem of finding the least noticeable horizontal or vertical “seam” through an image. Its diagram would be mostly like the one for longest common subsequence, but dependency arrows going N, NW, NE, instead of N, W, NW.

  2. wren ng thornton says:

    As Mike Rosulek said, you’re unlikely to find more chart shapes in 2D algorithms, but there are a bunch in 3D and 4D. In addition to Floyd–Warshall, Dijkstra’s, and similar graph algorithms, you also get all the various chart-based natural language parsing algorithms: CKY, Earley’s, dotted CKY,…

    Of course, the thing that makes DP interesting to study isn’t the shape of the chart, it’s the shape of the recurrences in the chart. And for that, the word wrapping problem and the bitonic Euclidean traveling salesman algorithm both show that there are some surprisingly interesting recurrence shapes aside from the usual shape of the previous 1-3 cells.

  3. Anonymous says:

    There’s actually a fun little story behind the name “dynamic programming”: the term was meant to be impressive and vague. Read more: http://arcanesentiment.blogspot.com/2010/04/why-dynamic-programming.html

  4. Jack says:

    This is exactly how I was taught dynamic programming in college – using tables as visualizations. One of the first ones we started with was the knapsack problem. Awesome post, brings back memories!

  5. Anonymous says:

    What does Viterbi look like?

  6. I remember trying to draw Viterbi, but I can’t remember off the top of my head why it didn’t make it into the final post. Lemme think about it. I think it’s just the standard trellis representation of the algorithm.

  7. Xiong Chiamiov says:

    @Mike Rosulek:

    I believe it is Cormen et al’s Introduction to Algorithms. It seems to be a common book, and the terminology of the edit problem is familiar to me.

  8. Simon Burton says:

    I used n-dimensional tables to get a grip on automatic differentiation. I assume this is the dynamic programming version of symbolic differentiation.

    See http://arrowtheory.com/SimonBurtonThesis.pdf section 4.2

  9. Joel M says:

    How are people so clever!? I wish my brain could swallow all this information as easily as some people. I’m studying to get onto a computer science university course but I doubt I’ll ever understand a lot of the things you talk about :(

  10. […] Come visualizzare il comportamento e quindi la complessità degli algoritmi di programmazione dinamica. […]

  11. […] Great dynamic programming article on visually calculating complexity – Link […]

  12. Mats says:

    I recall edit distance from Computational Genetics when doing genome sequence alignment, introduced as “that algorithm Wikipedia uses when you look at change history”. Ever since then, I have (unconsciously) thought of them as table-filling algorithms from the lecture graphs. Thanks for making me cognizant of this!

    However, after thinking about it some more, perhaps one could construct such algorithms that don’t have such a nice Euclidean structure? We’d then have to think of them as digraph-filling algorithms; in the above illustrated cases, the graph is nicely displayed by a 2D lattice; but we might have something complex like an arbitrarily-shaped graph. It may just happen that many of the problems we deal with in compsci are nicely representable by N-dimensional tables.

    Personally when teaching DP, I introduce it in terms of memoization, then work up to reasons one might want it (small stack size, sanity may require order-of-evaluation hints, optimization tricks). From now on I think I will include table-filling (with the above caveat) =)

Leave a Comment