Picturing binomial coefficient identities
Guys, I have a secret to admit: I’m terrified of binomials. When I was in high school, I had a traumatic experience with Donald Knuth’s The Art of Computer Programming: yeah, that book that everyone recommends but no one has actually read. (That’s not actually true, but that subject is the topic for another blog post.) I wasn’t able to solve any recommended exercises in the mathematical first chapter nor was I well versed enough in computers to figure out what assembly languages were about. But probably the most traumatizing bit was Knuth’s extremely compact treatment of the mathematical identities in the first chapter we were expected memorize. As I would find out later in my mathematical career, it pays to convince yourself that a given statement is true before diving into the mess of algebraic manipulation in order to actually prove it.
One of my favorite ways of convincing myself is visualization. Heck, it’s even a useful way of memorizing identities, especially when the involve multiple parameters as binomial coefficients do. If I ever needed to calculate a binomial coefficient, I’d be more likely to bust out Pascal’s triangle than use the original equation.
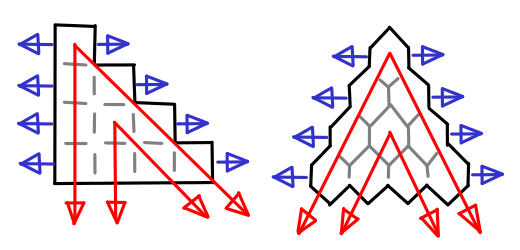
Of course, at some point you have to write mathematical notation, and when you need to do that, reliance on the symmetric rendition of Pascal’s triangle (pictured on the right) can be harmful. Without peeking, the addition rule is obvious in Pascal’s triangle, but what’s the correct mathematical formulation?


I hate memorizing details like this, because I know I’ll get it wrong sooner or later if I’m not using the fact regularly (and while binomials are indubitably useful to the computer scientist, I can’t say I use them frequently.)
Pictures, however. I can remember pictures.
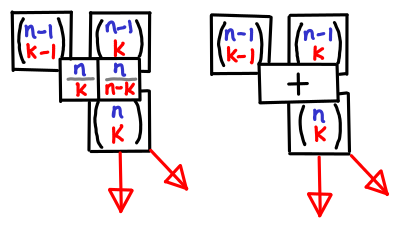
And if you visualize Pascal’s triangle as an actual table wih n on the y-axis and k on the x-axis, knowing where the spatial relationship of the boxes means you also know what the indexes are. It is a bit like visualizing dynamic programming. You can also more easily see the symmetry between a pair of equations like:


which are presented by the boxes on the left.
Of course, I’m not the first one to think of these visual aids. The “hockey stick identities” for summation down the diagonals of the traditional Pascal’s triangle are quite well known. I don’t think I’ve seen them pictured in tabular form, however. (I’ve also added row sums for completeness.)
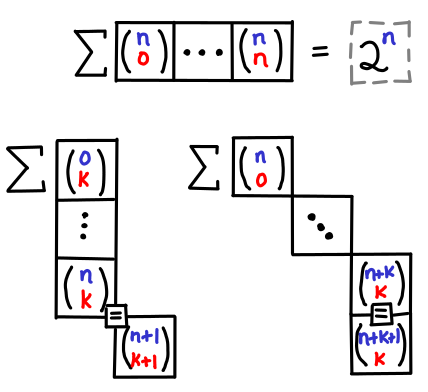
Symmetry is nice, but unfortunately our notation is not symmetric, and so for me, remembering the hockey stick identities this ways saves me the trouble from then having to figure out what the indexes are. Though I must admit, I’m curious if my readership feels the same way.